

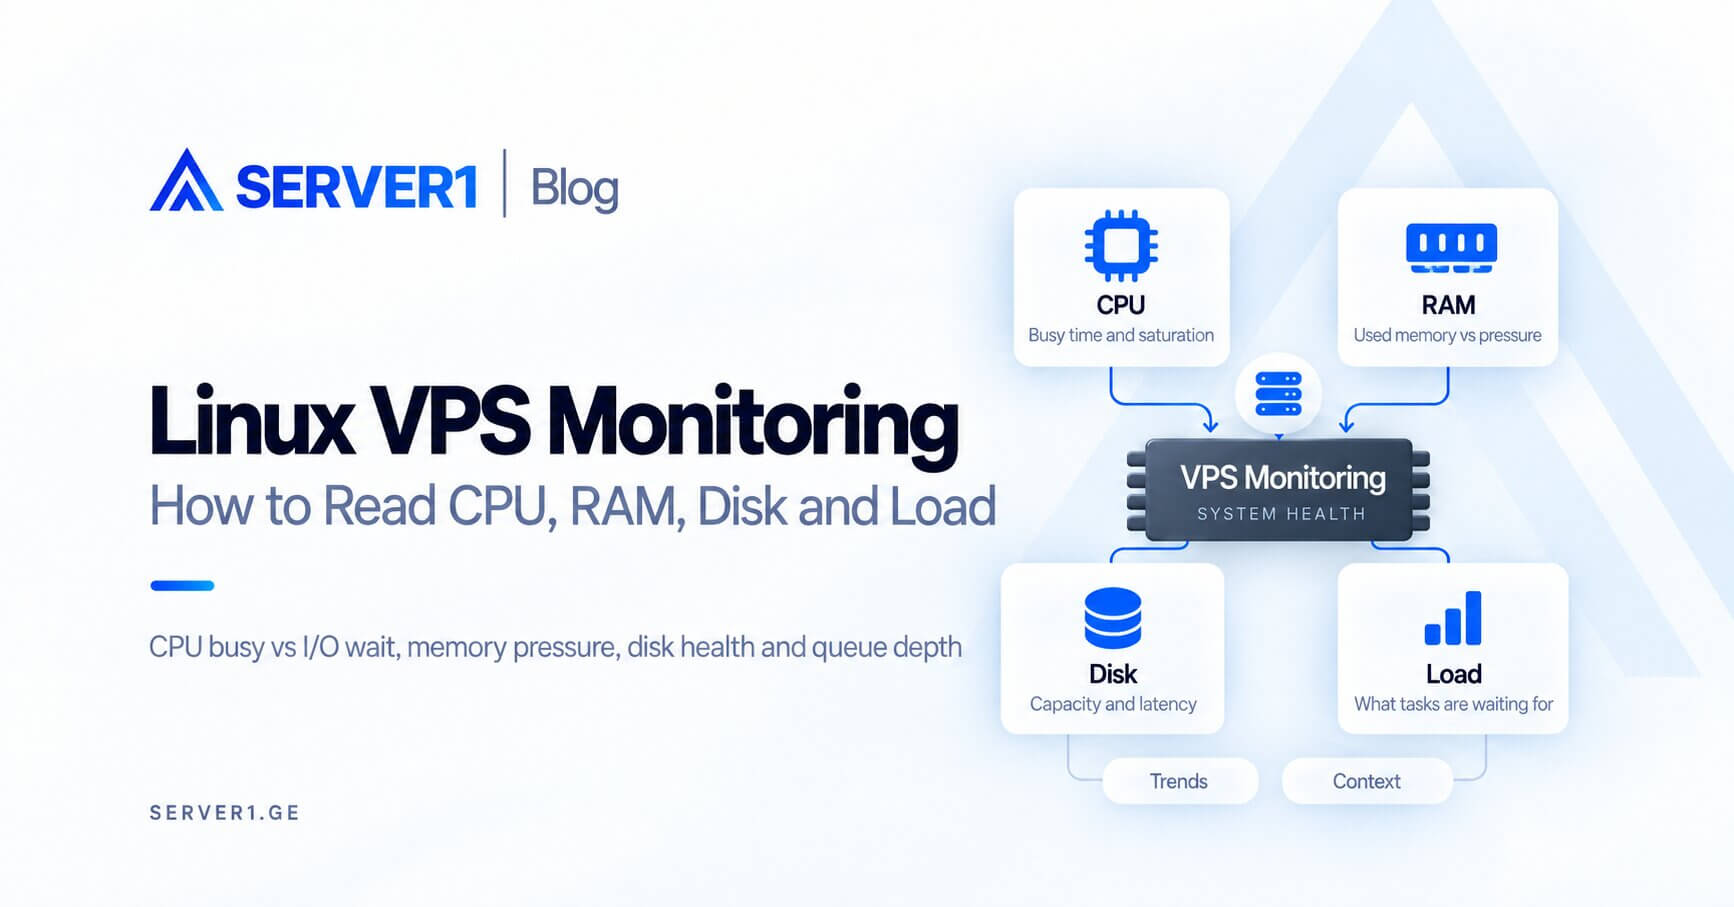
The goal of Linux VPS monitoring is not to collect the largest possible dashboard. You need to answer four questions: is CPU actually busy or are tasks waiting for I/O, is memory under pressure or simply used as page cache, are disk capacity and latency healthy, and what kind of queue is the load average reflecting?
A five-minute health check
| Metric | Question | Starting tool |
|---|---|---|
| CPU | busy, steal or iowait? | `top`, `mpstat` |
| RAM | available, swap, OOM? | `free -h`, `/proc/meminfo` |
| Disk | capacity, inodes, latency? | `df`, `iostat` |
| Load | runnable or I/O-wait jobs? | `uptime`, `/proc/loadavg` |
Load average is not a CPU percentage
Linux load average represents runnable tasks plus tasks in uninterruptible disk-I/O wait over 1, 5 and 15 minutes. A load of 4 does not automatically mean “400% CPU.” On a 4-vCPU VPS, load 4 can mean very different things depending on whether CPUs are saturated or tasks are waiting on storage.
Low “free” RAM is not automatically a problem
Linux aggressively uses otherwise free memory as page cache. The more useful signals are available memory, swap activity and OOM events. If swap is continuously active under pressure, see our detailed VPS swap guide.
Disk: monitor capacity and latency
- `df -h` for filesystem fullness;
- `df -i` for inode exhaustion;
- `iostat` or equivalent latency metrics for storage queues;
- logs for filesystem or application write failures.
Background jobs can create sudden disk and database pressure, so also review the background-workers guide.
An alert threshold is not one number
“CPU > 80%” without context creates noise. Better alerts combine duration and symptoms: CPU > 90% for ten minutes while p95 latency rises; disk > 85% with a high growth rate; low available memory with active swap-in/out.
Build a baseline before the incident
- record normal CPU/RAM/disk/load behavior;
- identify peak hours;
- mark deployments and backup windows;
- retain enough trend history to recognize drift;
- give every alert an owner and a first diagnostic action.
the server-management tools guide puts monitoring into operational context, while the downtime article explains why alerts should connect to business impact.
On Unmanaged VPS, monitoring and runbooks are fully your responsibility; use SERVER1 VPS when comparing resource tiers.
Good monitoring does not merely say “a number is high.” It helps explain what is degrading, why, and what to inspect next.